Stadium Wind Patterns Reshape Passing Data in Professional Football Seasons
Written by Zoe Carter · Nov 18, 2026
Stadium Wind Patterns Reshape Passing Data in Professional Football Seasons
Wind currents inside professional football stadiums create measurable shifts in passing efficiency metrics across multiple leagues, and data collected during the 2026 season highlights these patterns with increasing precision. Engineers and meteorologists have tracked how gusts interact with structural designs in venues ranging from fully enclosed domes to open-air facilities with partial roofing, while league statisticians compile completion percentages adjusted for environmental variables.
Structural Designs and Airflow Dynamics
Modern stadium architecture incorporates features like cantilevered roofs and tiered seating that channel wind in specific directions, and studies from atmospheric research groups show these elements generate swirling patterns near the field level. In facilities built with open end zones, prevailing winds accelerate along the length of the playing surface, whereas enclosed structures maintain more stable conditions except near ventilation intakes. Observers note that teams playing in stadiums with east-west orientations encounter consistent crosswinds during afternoon games, and this alignment correlates with adjusted route-running adjustments by receivers.
Researchers at institutions focused on sports aerodynamics have modeled these flows using computational fluid dynamics, and their simulations reveal velocity changes of up to 15 miles per hour in certain seating configurations. Data from November 2026 contests demonstrate that passing attempts into headwinds register lower average velocities at the release point compared to tailwind scenarios, although quarterbacks compensate through altered arm angles and ball spins.
Impact on Completion Rates and Route Efficiency
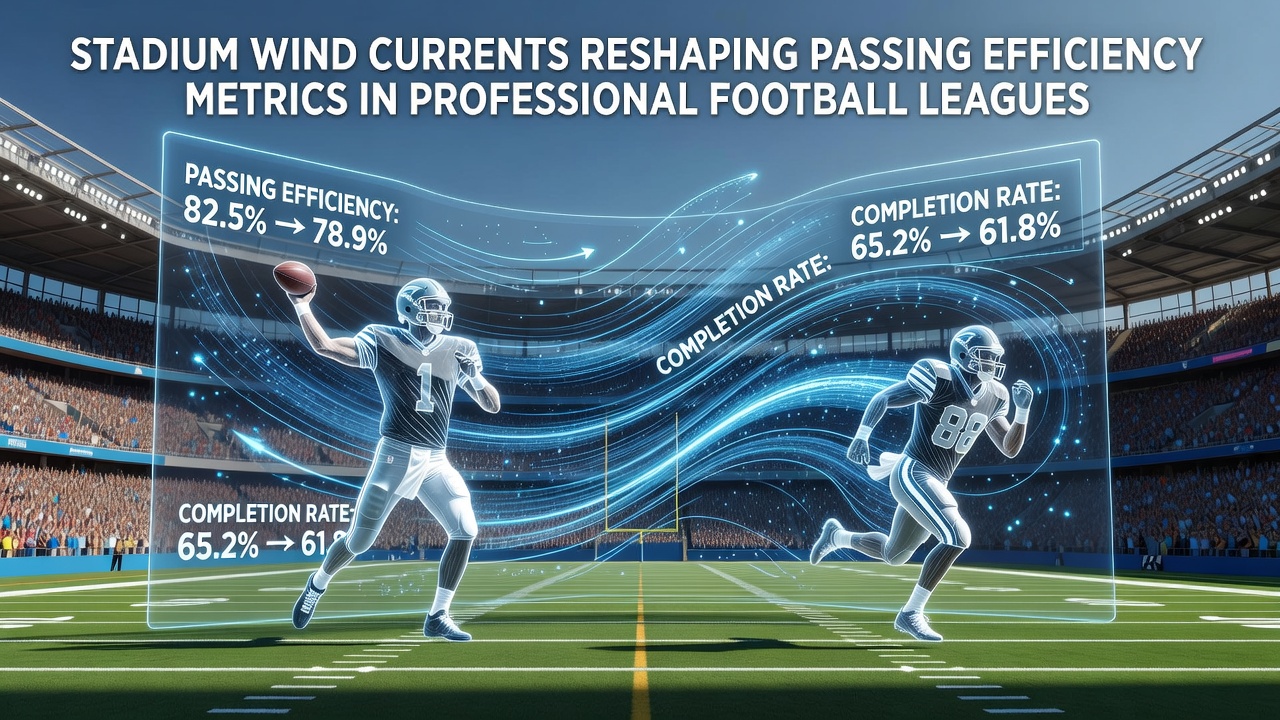
Passing efficiency metrics tracked by analytics platforms incorporate wind speed and direction as variables, and figures from the current professional season indicate measurable drops in completion percentages during windy conditions. Short routes benefit from reduced wind exposure due to quicker delivery times, while deeper patterns accumulate greater deflection over distance. League records show that games played in coastal stadiums, where sea breezes intensify in late afternoon, produce higher interception rates on intermediate throws than indoor equivalents.

Analysts have compared datasets from multiple venues, and evidence points to a consistent pattern where quarterbacks with higher release points maintain better accuracy when gusts exceed 12 miles per hour. Route concepts evolve accordingly, with coordinators favoring quick slants and screens over vertical options on blustery days. One study conducted across several North American facilities found that wind-adjusted expected completion rates differ by as much as eight percentage points from raw statistics, prompting revisions in player evaluation models.
Data Collection Methods and League Adjustments
Professional leagues now integrate on-site anemometers and weather stations into game-day protocols, and these tools supply real-time readings that feed into official statistical adjustments. Meteorologists collaborate with performance analysts to log wind vectors at multiple heights above the turf, and the resulting datasets allow for granular breakdowns by down, distance, and field position. According to reports from environment agencies in North America and Europe, standardized measurement practices have improved cross-venue comparability since their introduction in prior seasons.
Teams review historical wind profiles during preparation for road games, and scouting reports include venue-specific airflow summaries derived from long-term observations. This preparation extends to equipment considerations, such as ball inflation levels that resist excessive movement in turbulent air. Performance tracking organizations publish quarterly summaries that highlight these environmental influences alongside traditional metrics like yards per attempt.
Future Considerations for Venue Planning
Architects designing upcoming stadium projects incorporate wind tunnel testing earlier in the planning process, and these evaluations aim to minimize disruptive airflow near the sidelines and end zones. Data accumulated through 2026 informs decisions about roof geometry and facade treatments that could stabilize playing conditions without full enclosure. Industry reports from construction and engineering bodies emphasize that proactive modeling reduces variability in performance metrics across home and visiting squads.
Conclusion
Stadium wind currents continue to influence passing efficiency metrics through documented interactions between architecture and atmospheric conditions, with professional leagues responding through enhanced measurement and analytical frameworks. Continued refinement of these approaches supports more accurate evaluations of player and team performance across varied environments.